Structured Audit Log

jPOS Structured Audit Log (SAL)
Unlike most blog posts published here that are final, this one is being updated in parallel with the work we are doing on the structured audit log effort for jPOS. It will be finalized once this notice is removed.
The jPOS XML logs, written a quarter of a century ago, were intended to serve as an audit trail capable of being reprocessed later in the event of a major system failure. Over the years, they proved to be very useful, saving the day during migrations, testing, and even production issues.
Originally, these logs were structured audit logs, similar to what we aim to achieve now. However, as the system grew, the highly flexible Loggeable interface was sometimes improperly implemented, occasionally resulting in invalid XML. While still reasonably intelligible to the human eye, this made it difficult to parse the XML content automatically. Moreover, PCI requirements have become stricter over the years (there was no PCI 25 years ago, it was the Wild West), and data that might be needed to reprocess a transaction is now entirely masked.
The term log, much like byte, is widely overused in the field. With the advent of logging frameworks such as log4j, j.u.Logging, logback, and SLF4J, and then log aggregators that ingest loads of unstructured data into tools like Splunk, Datadog, and ElasticSearch/Kibana, you name it, there is confusion. People often conflate a log that outputs debug information line by line—which is undoubtedly useful—with addressing a different problem that's the one we aim to solve.
When I initially wrote the jPOS logger subsystem, large projects such as JBoss were looking for logging alternatives. I even had an email exchange with JBoss' author. He evaluated it but didn’t like it because it was too XMLish, which I found amusing since the whole JBoss configuration back in the day was heavily XML-based. Log4j was an early project hosted, if I recall correctly, at IBM’s alphaWorks, and that was his choice. Had I had that exchange a few weeks earlier, I would have adopted Log4j right away, as it was a promising project that proved to be the right way to go.
However, my concern and the focus of this post is not about the logger itself and its extensibility through SPIs, which are great. This post is about what one ends up putting in the log. It’s about the content and how to structure it in such a way that it becomes useful not only to the naked eye but also to other applications that ingest it.
In jPOS, it’s very common to encounter log events like the following:
<log realm="channel/186.48.107.208:58949" at="2024-04-29T13:06:13.086" lifespan="228ms">
  <receive>
    <isomsg direction="incoming">
      <!-- org.jpos.iso.packager.XMLPackager -->
      <field id="0" value="0800"/>
      <field id="11" value="000001"/>
      <field id="41" value="00000001"/>
      <field id="70" value="301"/>
    </isomsg>
  </receive>
</log>
<log realm="channel/186.48.107.208:58949" at="2024-04-29T13:06:13.618" lifespan="4ms">
  <send>
    <isomsg>
      <!-- org.jpos.iso.packager.XMLPackager -->
      <field id="0" value="0810"/>
      <field id="11" value="000001"/>
      <field id="37" value="743110"/>
      <field id="38" value="319046"/>
      <field id="39" value="0000"/>
      <field id="41" value="00000001"/>
      <field id="70" value="301"/>
    </isomsg>
  </send>
</log>
Now consider the following output:
2024-04-29 13:06:13.086 INFO Channel:23 - <log realm="channel/186.48.107.208:58949" at="2024-04-29T13:06:13.086" lifespan="228ms">
2024-04-29 13:06:13.086 INFO Channel:23 -   <receive>
2024-04-29 13:06:13.086 INFO Channel:23 -     <isomsg direction="incoming">
2024-04-29 13:06:13.086 INFO Channel:23 -       <!-- org.jpos.iso.packager.XMLPackager -->
2024-04-29 13:06:13.086 INFO Channel:23 -       <field id="0" value="0800"/>
2024-04-29 13:06:13.086 INFO Channel:23 -       <field id="11" value="000001"/>
2024-04-29 13:06:13.086 INFO Channel:23 -       <field id="41" value="00000001"/>
2024-04-29 13:06:13.086 INFO Channel:23 -       <field id="70" value="301"/>
2024-04-29 13:06:13.086 INFO Channel:23 -     </isomsg>
2024-04-29 13:06:13.086 INFO Channel:23 -   </receive>
2024-04-29 13:06:13.086 INFO Channel:23 - </log>
2024-04-29 13:06:13.086 INFO Channel:23 - <log realm="channel/186.48.107.208:58949" at="2024-04-29T13:06:13.618" lifespan="4ms">
2024-04-29 13:06:13.086 INFO Channel:23 -   <send>
2024-04-29 13:06:13.087 INFO Channel:23 -     <isomsg>
2024-04-29 13:06:13.087 INFO Channel:23 -       <!-- org.jpos.iso.packager.XMLPackager -->
2024-04-29 13:06:13.087 INFO Channel:23 -       <field id="0" value="0810"/>
2024-04-29 13:06:13.087 INFO Channel:23 -       <field id="11" value="000001"/>
2024-04-29 13:06:13.087 INFO Channel:23 -       <field id="37" value="743110"/>
2024-04-29 13:06:13.087 INFO Channel:23 -       <field id="38" value="319046"/>
2024-04-29 13:06:13.087 INFO Channel:23 -       <field id="39" value="0000"/>
2024-04-29 13:06:13.087 INFO Channel:23 -       <field id="41" value="00000001"/>
2024-04-29 13:06:13.087 INFO Channel:23 -       <field id="70" value="301"/>
2024-04-29 13:06:13.087 INFO Channel:23 -     </isomsg>
2024-04-29 13:06:13.087 INFO Channel:23 -   </send>
2024-04-29 13:06:13.087 INFO Channel:23 - </log>
This is actually a single log event and should go in a single log line. Frameworks support this, but most implementations I’ve seen in the wild, probably due to the fact that the event contains linefeeds, end up generating several dozen lines of logs, each with its own timestamp.
This output format presents several challenges:
- Readability: The output is difficult to read and requires additional string manipulation to parse effectively, which complicates debugging and analysis. Yes, you can always use
cutto take away the first chunk, but that's an extra step. - Excessive Detail: The granularity of timestamps down to milliseconds (e.g.,
086vs.087) is unnecessary and consumes resources without adding value to the debug information. - Instance-Based Configuration Limitations: In jPOS, a single Channel class may connect to numerous endpoints as both a client and a server in multi-tenant applications. It's important to manage logs separately per instance, yet typical line loggers tie configuration to the class rather than to instances. You can, of course, use parameterized logger names, but that's not the standard way people tend to log information in their applications, and there's no standard approach for doing this, so different teams implement it in various ways.
- Intermingling of Outputs: Line loggers mix outputs from multiple threads, necessitating the use of MDC (Mapped Diagnostic Context) to group together a logic log event. This approach increases code complexity and log verbosity.
- Operational Inefficiency: Analyzing logs often involves navigating VPNs and two-factor authentication, complicating access to third-party log aggregator interfaces. This is reasonable for an operations team in charge of an application, but it presents quite a problem for external development teams trying to assist in case of issues.
The jPOS Structured Audit Log intends to improve the existing jPOS logging system by addressing some of its flaws and enhancing the original goals. It supports compact, structured output that is suitable for ingestion by log aggregators, while still retaining the capability for easy, text-based log manipulation for debugging and emergency situations.
AuditLogEvent
To prevent conflicts with the existing system, we have introduced a new package named org.jpos.log, where this new feature is implemented. The main class within this package is AuditLogEvent. The intention is for AuditLogEvent to eventually replace the existing org.jpos.util.LogEvent.
The StructuredLogEvent is a very simple sealed interface:
public sealed interface AuditLogEvent permits ... { }
We used sealed interface in order to get compile-time errors if we miss to handle an AuditLogEvent, but there's extensibility provided by ServiceLoaders so that you can create your own.
Q2 Start event
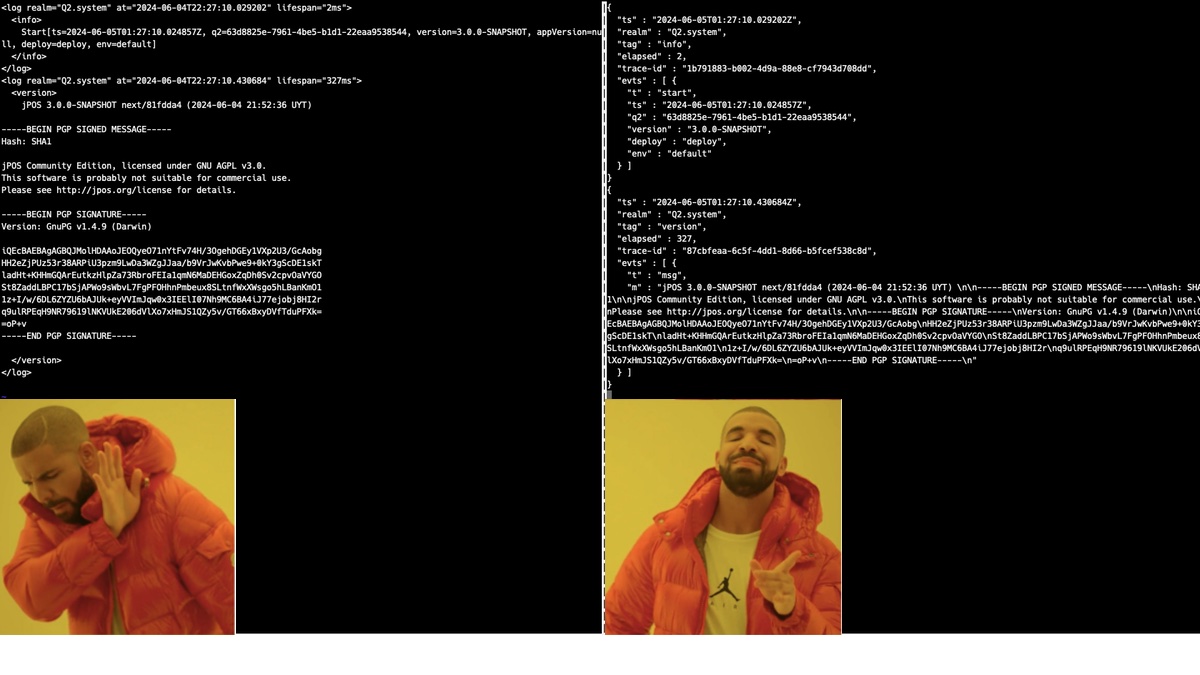
When a jPOS log starts, we usually get the following XML preamble:
<log realm="Q2.system" at="2024-06-06T16:48:44.290350" lifespan="1ms">
  <info>
    Q2 started, deployDir=/opt/local/jpos/deploy, environment=default
  </info>
</log>
The equivalente structured audit log event is:
{
  "ts" : "2024-06-06T19:49:30.577151Z",
  "realm" : "Q2.system",
  "tag" : "info",
  "trace-id" : "dbd2e6b6-693a-4ff5-9c51-5b2b643a8c8d",
  "evts" : [ {
    "t" : "start",
    "ts" : "2024-06-06T19:49:30.576244Z",
    "q2" : "6969be9c-dce9-4919-ad7e-69b5faf1ef33",
    "version" : "3.0.0-SNAPSHOT",
    "deploy" : "/opt/local/jpos/deploy",
    "env" : "default"
  } ]
}
We aim to keep these log messages as short and compression-friendly as possible. Given that JSON is verbose, we want to avoid extra boilerplate, especially for transaction messages that are repeated sometimes hundreds of millions of times daily. Therefore, we prefer using readable abbreviations like ts for timestamp and tx for transmission, etc. Here, we are showing pretty-printed output; however, the actual output will be a compact one-liner. The encoding is assumed to be UTF-8.
Each JSON object needs to be easily unmarshalled by different applications. To distinguish between various types of messages, every SAL message includes a unique type property (abbreviated as t) to facilitate polymorphic deserialization.
In jPOS SAL, there are two types of audit log records:
- jPOS native audit log records.
- Application-specific audit log extensions (those that you can load via service loaders).
SAL Native audit log records are defined under the new org.jpos.log.evt package and are part of the AuditLogEvent sealed interface.
Application-specific audit log messages are loaded via the ServiceLoader (META-INF/services/org.jpos.log.AuditLogEvent).
The Start StructuredLogEvent is defined like this:
public record Start(Instant ts, UUID q2, String version, String appVersion, String deploy, String env) implements AuditLogEvent { }
clazzis the logger’s class (i.e. DailyLogListener)q2is Q2’s instance Idversionis Q2’s versionappVersionis the application’s version
Q2 Stop event
Instead of the old </logger> closing element, we'll have an end JSON event
The Stop AuditLogEvent is defined as:
public record Stop(Instant ts, UUID id, Duration uptime) implements AuditLogEvent { }
The JSON output lookw like this:
{
  "ts" : "2024-06-06T19:49:38.050499Z",
  "realm" : "Q2.system",
  "tag" : "info",
  "trace-id" : "446c7ed1-ba61-4f5c-9f13-3edf1699242f",
  "evts" : [ {
    "t" : "stop",
    "ts" : "2024-06-06T19:49:38.050480Z",
    "id" : "6969be9c-dce9-4919-ad7e-69b5faf1ef33",
    "uptime" : 7.827676000
  } ]
}
LogWriters, LogRenderers, AuditLogEvents
jPOS users are familiar with channels, packagers, and ISOMsgs, and there's an analogy between these components.
An AuditLogEvent is analogous to an ISOMsg. It is an object that encapsulates information.
The LogRenderer functions like a packager. It converts the AuditLogEvent into a wire format. Just as you can have multiple packagers to handle different ISO-8583 variants, you can have multiple LogRenderers to convert AuditLogEvents into different formats.
We currently handle four formats:
TXT: A new format suitable for injection into regular line loggers.XML: Equivalent to the existing format.JSON: As shown in the examples above.MARKDOWN: Suitable for use during development/tests or for rendering in web-based UIs.
Finally, the LogWriter is like the channel, it's the one in charge to output the already rendered AuditLogEvent to the log PrintStream.
Please note that a LogListener can use a regular logger, by using for example the LogbackLogListener. Using LogbackLogListener with a TXT renderer provides a very predictable output.
LogWriter
The LogWriter interface, contributed by Alwyn not so long ago, is a great addition. It plugs into a LogListener and is very easy to configure:
<log-listener class="org.jpos.util.SimpleLogListener" enabled="true">
    <writer class="org.jpos.util.JsonLogWriter" enabled="true" />
</log-listener>
If we do not specify a writer, the log listener behaves like the traditional jPOS. It outputs all Loggeable objects using their dump method. We have JsonLogWriter, MarkdownLogWriter, TxtLogWriter, and XmlLogWriter.
The XmlLogWriter's output is slightly different from the standard no-writer Loggeable dumps as it enforces XML output to be provided via Jackson's ObjectMapper, hence producing guaranteed XML.
LogRenderer
The LogRenderers interface looks like this:
public interface LogRenderer<T> {
    void render (T obj, PrintStream ps, String indent);
    Class<?> clazz();
    Type type();
    ...
    ...
}
The renderers are then loaded via the org.jpos.log.LogRenderer service loader that looks like this:
org.jpos.log.render.json.LogEventJsonLogRenderer
org.jpos.log.render.json.LoggeableJsonLogRenderer
org.jpos.log.render.json.AuditLogEventJsonLogRenderer

org.jpos.log.render.xml.LoggeableXmlLogRenderer

org.jpos.log.render.markdown.ProfilerMarkdownRenderer
org.jpos.log.render.markdown.ContextMarkdownRenderer
org.jpos.log.render.markdown.LoggeableMarkdownLogRenderer
org.jpos.log.render.markdown.LogEventMarkdownRenderer
org.jpos.log.render.markdown.StringMarkdownLogRenderer
org.jpos.log.render.markdown.ObjectMarkdownLogRenderer
org.jpos.log.render.markdown.ByteArrayMarkdownLogRenderer
org.jpos.log.render.markdown.ThrowableMarkdownLogRenderer
org.jpos.log.render.markdown.ElementMarkdownLogRenderer
org.jpos.log.render.markdown.TransactionManagerTraceMarkdownLogRenderer
org.jpos.log.render.markdown.TransactionManagerTraceArrayMarkdownLogRenderer
...
...
There's a handy LogRendererRegistry that can get you a renderer for any given object. It properly traverses the class hierarchy and implementation hierarchy to get the most suitable renderer for an object if one is not defined for a given class. Because that reflection-based traversal is expensive, all results are cached and readily available for the next call.
Renderer implementations are very easy to write, and we encourage users to create specific ones for their objects. We aim to provide a large number of renderers for jPOS objects. Here is an example of a ByteArray renderer that produces Markdown output:
public final class ByteArrayMarkdownLogRenderer implements LogRenderer<byte[]> {
    @Override
    public void render(byte[] b, PrintStream ps, String indent) {
        if (b.length > 16) {
            ps.printf ("```%n%s%n```%n", indent(indent, ISOUtil.hexdump(b)));
        } else {
            ps.printf ("`%s`%n", indent(indent,ISOUtil.hexString(b)));
        }
    }
    public Class<?> clazz() {
        return byte[].class;
    }
    public Type type() {
        return Type.MARKDOWN;
    }
}
This is a just-for-fun proof of concept that outputs a jPOS profiler as a Markdown table:
public final class ProfilerMarkdownRenderer implements LogRenderer<Profiler> {
    public ProfilerMarkdownRenderer() {
    }

    @Override
    public void render(Profiler prof, PrintStream ps, String indent) {
        var events = prof.getEvents();
        int width = maxLength(events.keySet());
        final String fmt = STR."| %-\{width}s | %10.10s | %10.10s |%n";
        ps.print (row(fmt, "Checkpoint", "Elapsed", "Total"));
        ps.print(
          row(fmt, "-".repeat(width), "---------:", "-------:")
        );
        StringBuilder graph = new StringBuilder();
        events.forEach((key, v) -> {
            ps.print(
              row(fmt, v.getEventName(), toMillis(v.getDurationInNanos()), toMillis(v.getTotalDurationInNanos()))
            );
            graph.append ("  \"%s\" : %s%n".formatted(key, toMillis(v.getDurationInNanos())));
        });
        ps.println();
        ps.println ("```mermaid");
        ps.println ("pie title Profiler");
        ps.println (graph);
        ps.println ("```");

    }
    public Class<?> clazz() {
        return Profiler.class;
    }

    public Type type() {
        return Type.MARKDOWN;
    }
    private String row (String fmt, String c1, String c2, String c3) {
        return fmt.formatted(c1, c2, c3);
    }
    private String toString(Profiler.Entry e, String fmt) {
        return FMT."""
          \{fmt}s |\{toMillis(e.getDurationInNanos())} | \{toMillis(e.getTotalDurationInNanos())} |
          """.formatted(e.getEventName());
    }

    private String toMillis(long nanos) {
        return FMT."%d\{nanos / Profiler.TO_MILLIS}.%03d\{nanos % Profiler.TO_MILLIS % 1000}";
    }

    private int maxLength (Set<String> keys) {
        return keys.stream()
          .mapToInt(String::length)
          .max()
          .orElse(0); // R
    }
}
StringTemplates look nice!
With the previous renderer, the regular profiler output:
    <profiler>
      prepare: o.j.t.p.Debug [8.8/8.8]
      prepare: o.j.t.p.Debug-1 [0.7/9.6]
      prepare: o.j.t.p.Delay [2.4/12.0]
      prepare: o.j.t.p.Trace [0.6/12.7]
       commit: o.j.t.p.Debug [1.9/14.7]
       commit: o.j.t.p.Debug-1 [0.4/15.1]
       commit: o.j.t.p.Delay [0.4/15.6]
       commit: o.j.t.p.Trace [0.5/16.1]
      end [7.6/23.7]
    </profiler>
Looks like this:
| Checkpoint | Elapsed | Total |
|---|---|---|
| prepare: o.j.t.p.Debug | 8.083 | 8.083 |
| prepare: o.j.t.p.Debug-1 | 0.500 | 9.583 |
| prepare: o.j.t.p.Delay | 2.000 | 12.583 |
| prepare: o.j.t.p.Trace | 0.875 | 12.458 |
| commit: o.j.t.p.Debug | 1.042 | 14.500 |
| commit: o.j.t.p.Debug-1 | 0.375 | 15.875 |
| commit: o.j.t.p.Delay | 0.458 | 15.333 |
| commit: o.j.t.p.Trace | 0.500 | 16.833 |
Why, you may ask? You just want good JSON output to feed your aggregator, and we have you covered. But once little pieces like this start to fit perfectly into the system, we are tempted to play with additional options. In a production environment, you want a compact JSON format from the AuditLogEvents. When you're in the development phase—which we are most of the time—having a nice Markdown output ready to be copied and pasted into an issue, email, or discussion is a good thing to have. And if it includes awesome Mermaid graphics, even better!
Recap on why we are doing this
People often use Grok, Fluentd, Splunk regexp-based filters, or just grep/AWK manipulation to make sense of log messages produced by applications. These applications sometimes decide to change the message format from:
Starting
to:
 ____  _             _   _
/ ___|| |_ __ _ _ __| |_(_)_ __   __ _
\___ \| __/ _` | '__| __| | '_ \ / _` |
 ___) | || (_| | |  | |_| | | | | (_| |
|____/ \__\__,_|_|   \__|_|_| |_|\__, |
                                 |___/
Because banners are cool, they inadvertently trick those regexps with an innocent change.
We want jPOS audit logs to be precise, compact, and suitable for storage (e.g., in jPOS' binlog) for audit purposes
Stay tuned as this is coming soon to jPOS next.