jPOS Tutorial: New Sections Added
The jPOS tutorial has been expanded with several new sections covering some of the most commonly used — and most commonly misunderstood — parts of the framework.
I recently tweeted about something I see coming: maintainer overflow (X).

I have been the maintainer of the jPOS project for a quarter of a century now. Over the years, pull requests of very different quality have come and gone.
The good ones—the ones that truly move the project forward—usually bubble up from discussions on the mailing list, Slack, or at our meets. Although we don’t have a formal process—we are not that big—they tend to originate from some kind of JEP, a jPOS Enhancement Proposal. There is context. There is discussion. There is intent.
From time to time, we get the smart developer blasting 100 projects with the same trivial scripted PR—changing a StringBuffer to a StringBuilder, or replacing a Hashtable with a HashMap. Those changes could be welcome, if not for the typical tone that reads like:
“Dramatically improve the performance of this project with my genius discovery of this new Java class.”
I usually respond with a few questions. And if the refactor includes more than a handful of lines, we need to talk about a CLA. That’s often when the silence begins.
These developers remind me of my old days in ham radio, when the Russian Woodpecker radar would sweep across the band—pahka pahka pahka pahka pahka—blasting your headphones in the middle of the night, and then disappearing.
I believe these kinds of PRs will soon arrive in the hundreds. We already see “CRITICAL” ones created by developers trying to collect internet karma by prompting their AI agent with a junior-level request and submitting whatever comes out.
Let me be clear: all improvements are welcome.
But well-established projects, running in production at very large companies and handling literally billions of dollars daily—like jPOS—require an extremely cautious approval process.
We follow PCI requirements. ISO/IEC 27001. ISO/IEC 20243 supply-chain assessments. We must be careful.
Analyzing a PR produced by AI is an order of magnitude more complex than prompting your own AI to explore the same idea. When you prompt it yourself, you can walk through the plan, tweak it, ask questions about side effects, keep the broader roadmap in mind, inspect the generated diffs, and request tests where you fear an edge case could beat you—or where you remember it already did.
Reviewing a blind AI-generated PR reverses that process. The maintainer has to reconstruct the intent, guess the prompt, and audit the reasoning after the fact. That is expensive.
It is much easier to receive a prompt—possibly with a detailed plan and some sample tests—than to receive a finished pull request.
So here is a proposal.
Instead of sending Pull Requests, consider sending Prompt Requests.
A Prompt Request describes:
That allows the maintainer to evaluate the reasoning before evaluating the diff. It allows iteration before code lands. It allows us to align with the roadmap, compliance requirements, and architectural direction.
In many cases, the maintainer can then take the prompt, refine it, test it with different models, and generate the final implementation under controlled conditions.
Or decide that it’s not the right change.
I'm basically saying: Give it here—I’ll do it myself, genius. :)
We are pleased to announce the release of jPOS 3.0.1, a stabilization update to the 3.x line that focuses on robustness, observability, and production hardening.
While 3.0.0 was a major leap forward—introducing Virtual Threads, Micrometer instrumentation, Java Flight Recorder integration, and full JPMS support—3.0.1 consolidates that foundation. This release incorporates a large number of bug fixes, performance refinements, dependency updates, and operational improvements. Most importantly, it is already running in production at several large sites, validating the architectural decisions made in 3.0.0 under real-world load.
Several improvements target operational stability:
ChannelAdaptor reconnect logic and early detection of dead peers.ChannelAdaptor.ISOServer now gracefully catches BindException.MUXPool startup is more lenient with missing muxes and sanitizes configuration.In addition, the new ConfigValidator helps catch configuration issues early, reducing deployment-time surprises.
Virtual Threads were one of the flagship features of jPOS 3. This release refines their adoption:
virtual-thread property to ISOServer (default false), ChannelAdaptor (default false), and TransactionManager (default true).DirPoll now supports Virtual Threads.These additions give operators more explicit control when tuning thread behavior in mixed or incremental migration scenarios.
Observability continues to improve:
Metrics utility class for easier Micrometer access./jpos/q2/status endpoint when metrics are enabled.PrometheusMeterRegistry.throwExceptionOnRegistrationFailure to surface misconfiguration early.These changes improve clarity and safety in high-volume environments where metric cardinality and instrumentation correctness matter.
Q2 receives several important improvements:
Q2.node() (now static).QFactory method to instantiate from Element.enabled attribute on additional QServer child elements.Together, these changes make Q2 more flexible in embedded, modular, and containerized deployments.
As part of ongoing maintenance and supply-chain hygiene:
We also export org.jpos.iso.channel.* via JPMS, further improving modular compatibility.
SnapshotLogListener.LSPace.Environment.resolve(String).If you are already on 3.0.0, this is a strongly recommended upgrade. It strengthens the runtime characteristics of the 3.x architecture, improves observability, tightens security posture, and incorporates extensive real-world feedback from early adopters.
If you are coming from jPOS 2.x, 3.0.1 represents a mature entry point into the modernized 3.x line—bringing Virtual Threads, Micrometer-based instrumentation, JPMS support, and structured logging into a stable, production-validated release.
References:
/by Orlando Pagano a.k.a. Orly/
As of jPOS 3, a Docker Compose setup is included out of the box to monitor jPOS using Prometheus and Grafana.
This setup provides a ready-to-use environment to visualize metrics exposed by the jPOS metrics module, with preconfigured dashboard and data source.
.
├── grafana
│ └── dashboards
│ ├── jPOS.json
│ └── JVM.json
│ └── provisioning
│ ├── dashboards
│ │ └── dashboards.yaml
│ └── datasources
│ └── datasource.yaml
├── prometheus
│ └── prometheus.yaml
└── compose.yaml
compose.yaml
services:
prometheus:
image: prom/prometheus
...
ports:
- 9090:9090
grafana:
image: grafana/grafana
...
ports:
- 3000:3000
This Compose file defines a stack with two services: prometheus and grafana.
When deploying the stack, Docker maps each service's default port to the host:
Note: Ensure ports 9090 and 3000 on the host are available.
You don’t need any additional infrastructure — both services run entirely via Docker containers.
/prometheus inside the container.
To retain metrics across restarts, mount a persistent volume — otherwise, data will be lost when the container is rebuilt or removed.To start the monitoring stack:
$ cd <jPOS-monitoring-root>/dockerfiles/jPOS-monitoring
$ docker compose up -d
[+] Running 4/4
✔ Network jpos-monitoring_dashboard-network Created 0.0s
✔ Volume "jpos-monitoring_prom_data" Created 0.0s
✔ Container prometheus Started 0.4s
✔ Container grafana Started
Additionally, the just tool is included as an optional helper to simplify command execution.
Requirement: just (Installation guide)
To start the monitoring stack using just tool:
$ just monitoring-up
Confirm that both containers are running and ports are correctly mapped:
$ docker ps
CONTAINER ID IMAGE COMMAND STATUS PORTS NAMES
dbdec637814f prom/prometheus "/bin/prometheus --c…" Up 8 mins 0.0.0.0:9090->9090/tcp prometheus
79f667cb7dc2 grafana/grafana "/run.sh" Up 8 mins 0.0.0.0:3000->3000/tcp grafana
Open http://localhost:3000 to access Grafana.
admin / grafana. Prometheus is preconfigured as the default data source.Open http://localhost:9090 to access Prometheus
To stop and remove the containers:
$ docker compose down # Use -v to remove volumes
To stop using just tool:
$ just monitoring-down
To stop and remove the containers using just tool:
$ just monitoring-down-remove
At the jPOS level, you only need to expose the metrics endpoint using the -mp option:
$ q2 -mp 18583
You can use any port, but 18583 is the conventional default in jPOS for metrics.
To verify it's working:
$ curl http://localhost:18583/metrics
This confirms the embedded jPOS metrics server is accessible.
cfg/default.ymlPort 18583 is the default port used by the jPOS metrics server, but that’s just an arbitrary value and can be configured in cfg/default.yml or as a parameter to the bin/q2 script.
If you configure using cfg/default.yml, you need to add something like this:
q2:
args:
--metrics-port=18583
This keeps the port definition centralized and consistent across environments.
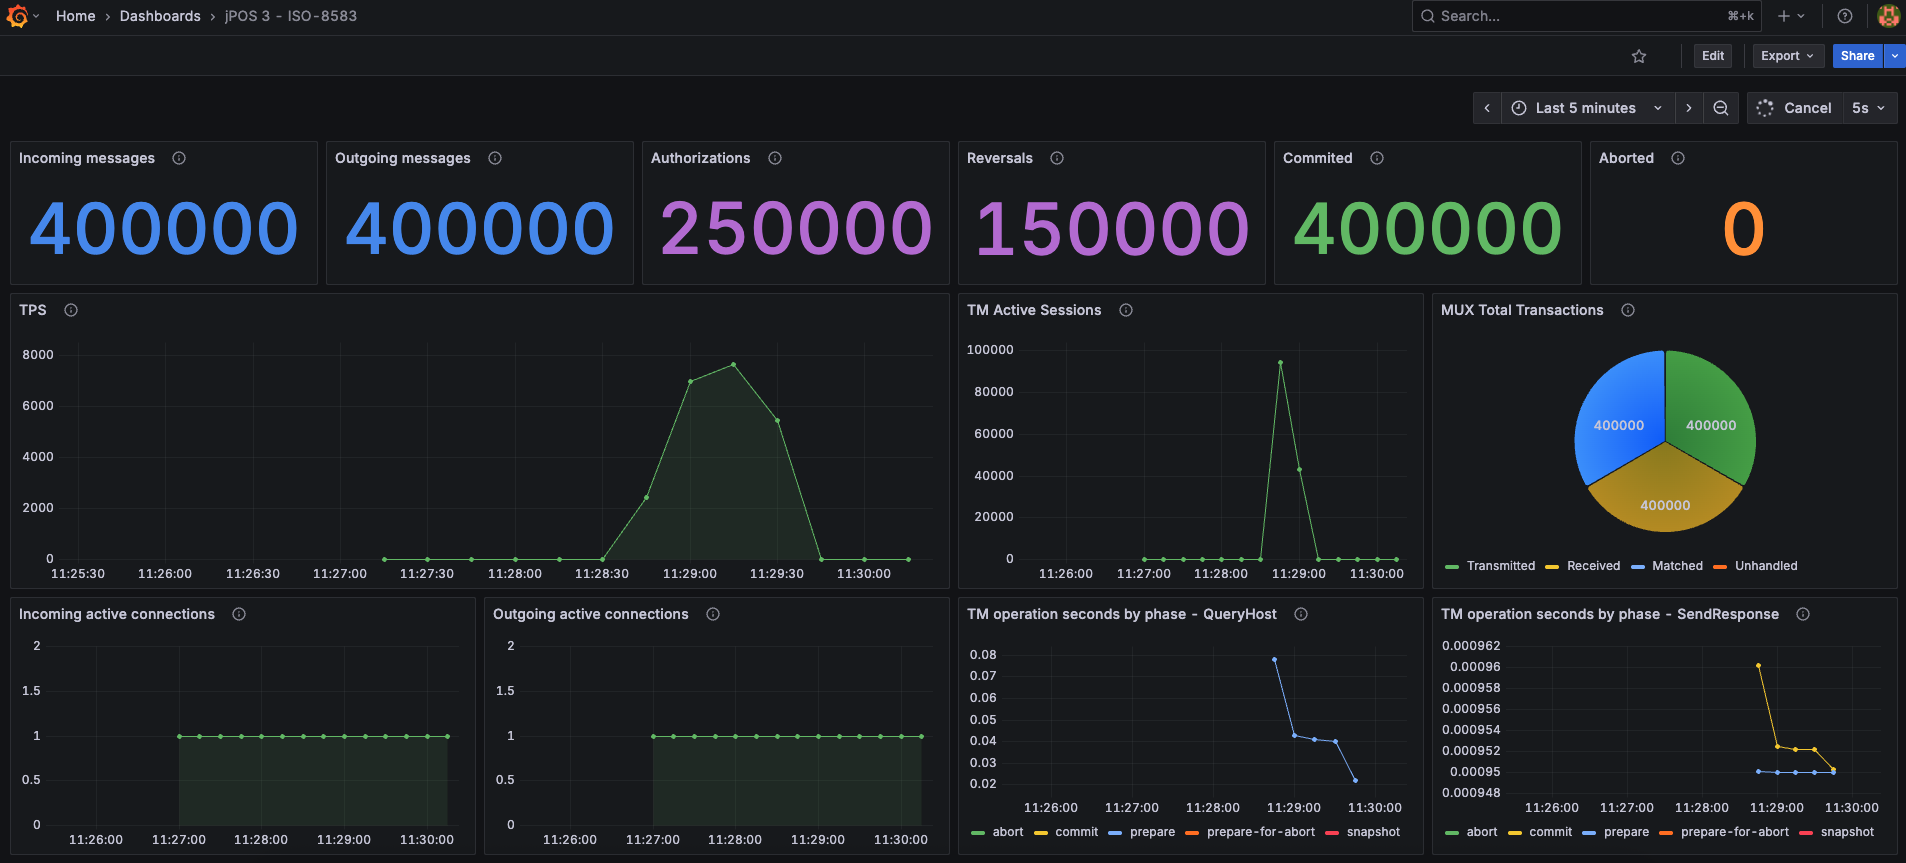
Here’s what you’ll see once everything is running:
This dashboard provides insights into jPOS-specific metrics such as ISO messages processed, TPS, MUX activity, active sessions, and active connections.
By default, the dashboard assumes that the TransactionManager runs the QueryHost and SendResponse participants, and their metrics are displayed.
Metrics from other participants can also be added, or existing ones edited or removed as needed.
This dashboard tracks JVM-level stats like memory usage, garbage collection, thread counts, and class loading.
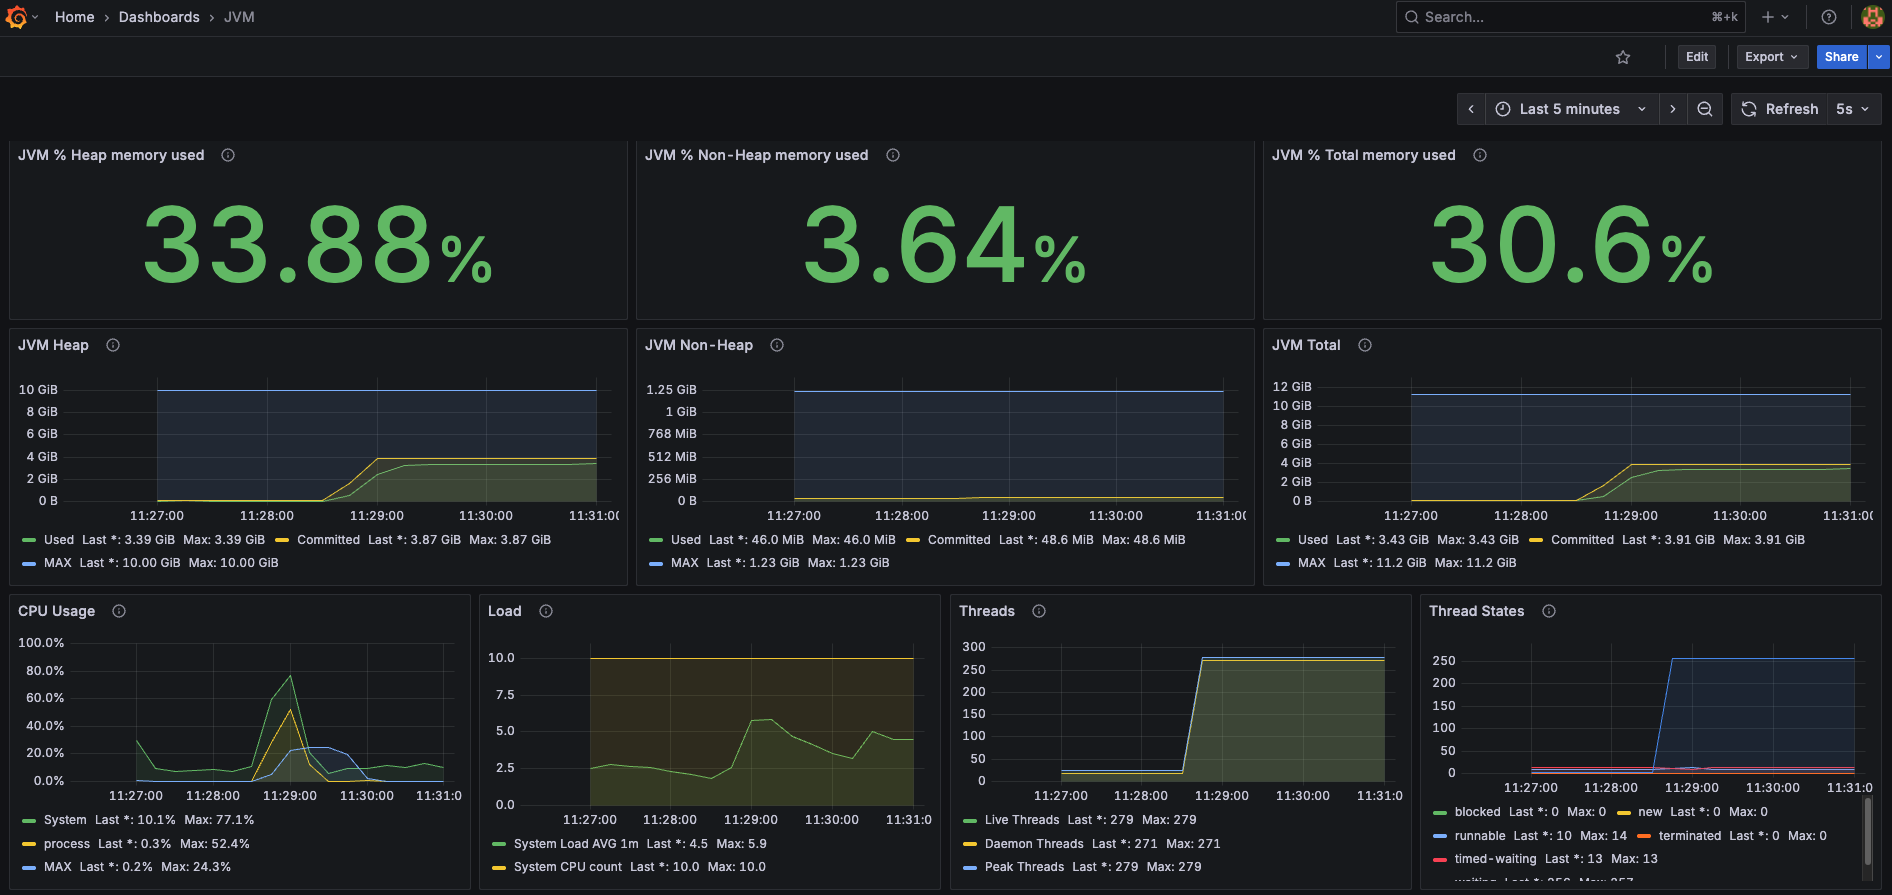
These dashboards are available in the repository under
grafana/dashboards/.
By default, the Grafana dashboard includes three predefined variables that can be customized as needed:
gateway – Used within the dashboard as name="$gateway"
This corresponds to the name assigned to the QServer instance that receives incoming messages in jPOS.
Example:
<server class="org.jpos.q2.iso.QServer" name="gateway">
txnmgr – Used within the dashboard as name="$txnmgr"
This corresponds to the name of the TransactionManager responsible for orchestrating the participants in jPOS.
Example:
<txnmgr class="org.jpos.transaction.TransactionManager" name="txnmgr">
mux – Used within the dashboard as name="$mux"
This corresponds to the name assigned to the QMUX used by jPOS to communicate with an external network.
Example:
<mux class="org.jpos.q2.iso.QMUX" name="mux">
A screenshot of the dashboard variable editor is included below to illustrate where these values can be modified.
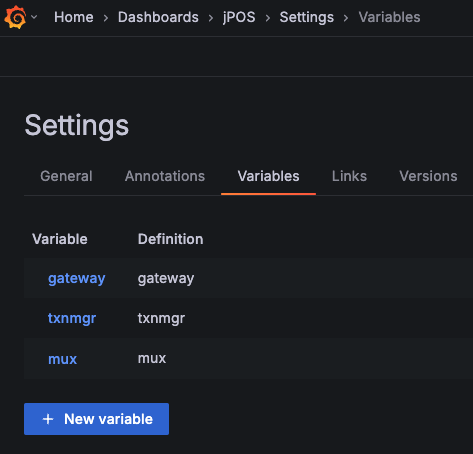
All dashboards, variables, and other Grafana configurations can be modified as needed to fit your specific setup or preferences.

If you already have a local copy of jPOS (master or next), please note there are REQUIRED ACTIONS at the end of this blog post
When we started work on jPOS 3.x on the new next branch, the plan was to rename the existing master branch (jPOS 2 series) to v2 and then migrate the next branch to main, aligning with the new industry default branch naming convention for the default repository (main) upon the release of jPOS 3.0.0.
Now that jPOS 3.0.0 has been released, we can see how it aligns perfectly with JEP-14, The Tip & Tail Model of Library Development, which fits our approach seamlessly.
(from JEP-14 summary)
..… The tip release of a library contains new features and bug fixes, while tail releases contain only critical bug fixes. As little as possible is backported from the tip to the tails. The JDK has used tip & tail since 2018 to deliver new features at a faster pace, as well as to provide reliable and predictable updates for users focused on stability.
So, we slightly adjusted our branch plan as follows:
master branch (jPOS 2) will be renamed to tail.next branch (jPOS 3) will be renamed to main.We briefly considered naming the main branch tip to better align with JEP-14 terminology. However, most developers are already familiar with the term main, and migrating projects from master to main for political correctness was challenging enough. Since main is now the default for new repositories, we’ve decided not to deviate further to avoid unnecessary confusion.
Bottom line: We have two important branches now. main is our Tip, jPOS 3, where all the exiting development goes. tail is currently the latest 2-series. The branching plan looks like this:
next branch:git branch -m next main
git fetch origin
git branch -u origin/main main
git remote set-head origin -a
master branch:git branch -m master tail
git fetch origin
git branch -u origin/tail tail
Once we test this new branch plan, we'll use it in jPOS-EE as well.
We are excited to announce the release of jPOS 3.0.0, marking a significant step forward in the evolution of the project. This release delivers substantial improvements, feature additions, and modernization efforts aimed at enhancing flexibility, performance, and security.
For a long time, jPOS has evolved version after version, maintaining almost 100% backward compatibility with previous releases—never rocking the boat, so to speak. However, to preserve this backward compatibility, we’ve had to hold back from fully embracing advancements in the Java ecosystem, especially the rapid development and release pace of OpenJDK, which is delivering incredible results and exciting new features.
In 2022, we announced jPOS Next, introducing a new branch naming convention: master and next. Unintentionally, we ended up implementing something closely aligned with the JEP 14: Tip & Tail release model that was recently published. Our current next branch functions as the Tip, while master serves as the Tail. In the future, we may adjust this naming to better align with the JEP 14 terminology.
Tip & tail is a release model for software libraries that gives application developers a better experience while helping library developers innovate faster. The tip release of a library contains new features and bug fixes, while tail releases contain only critical bug fixes. As little as possible is backported from the tip to the tails. The JDK has used tip & tail since 2018 to deliver new features at a faster pace, as well as to provide reliable and predictable updates for users focused on stability.
If we had to highlight one key feature of jPOS 3, it would be the use of Virtual Threads in critical components like the TransactionManager, QServer, ChannelAdaptor, and more. This innovation is also one of the reasons the release took longer than expected. While we initially aimed to launch alongside Java 21, that version had some issues with pinned platform threads that were later improved in Java 22 and 23. We are now eagerly anticipating Java 24 for even better performance.
With jPOS 3, the TransactionManager continuations—once a groundbreaking reactive programming feature (long before "reactive programming" became a trend)—are now obsolete. Thanks to Virtual Threads, we can safely handle 100k or more concurrent sessions in the TM without any issues. Virtual Threads are incredibly lightweight and efficient, marking a significant leap forward for jPOS.
As an example, consider a 15-second SLA with a sustained load of 5,000 transactions per second (TPS). That results in 75,000 in-flight transactions—a load that would be unreasonable to handle with traditional platform threads due to resource constraints. However, with Virtual Threads, this scenario becomes entirely manageable, showcasing their incredible efficiency and scalability for high-throughput environments.
Higher loads introduce new challenges. While managing a system with a few hundred threads was feasible using jPOS’s internal logging tools, like the SystemMonitor and the Q2 log, it becomes unmanageable with 100k+ threads. To address this, we’ve implemented new structured audit logging, integrated Java Flight Recorder, and introduced comprehensive Micrometer-based instrumentation to provide better visibility and control.
In jPOS 2, we used HdrHistogram directly to handle certain TransactionManager-specific metrics. While it was a useful tool for profiling edge cases and offering limited visibility into remote production systems, we fell short in providing robust additional tooling. In jPOS 3, we still rely on HdrHistogram, but instead of using it directly, we now leverage Micrometer—an outstanding, well-designed library that integrates seamlessly with standard tools like Prometheus and OpenTelemetry.
jPOS 3 also includes an embedded Prometheus endpoint server, which can be used out of the box (see q2 --help, in particular the --metrics-port and --metrics-path switches). This provides lightweight yet powerful visibility into channels, servers, multiplexers, and, of course, the TransactionManager and its participants.
jPOS 3 incorporates Java Flight Recorder (JFR) instrumentation at key points within the TransactionManager, the Space and other sensitive components. This provides deeper insights into application use cases and generates valuable profiling information, enabling us to implement continuous performance improvements effectively.
The Structured Audit Log supports TXT, XML, JSON, and Markdown output and is set to eventually phase out the current jPOS XML-flavored log that has served us well over the years. While the existing log is excellent for development, QA, and small tests, it struggles to handle massive data volumes efficiently. The new structured audit log, built on Java Records that extend the sealed interface AuditLogEvent, is designed to be both human-readable and compact for log aggregation, offering a much more scalable and user-friendly solution. In previous versions of jPOS, we used the ProtectedLogListener, which operated on live LogEvent objects by cloning and modifying certain fields. With the new approach, we’ve laid the groundwork for implementing annotation-based security directly on the log records. This ensures that sensitive data is never leaked under any circumstances.
module-infojPOS 3 fully embraces the Java Platform Module System (JPMS) by including module-info descriptors in its core modules. This allows developers to take full advantage of Java’s modular architecture, ensuring strong encapsulation, improved security, and better dependency management. By supporting Java modules, jPOS integrates seamlessly into modern modularized applications, making it easier to define clear module boundaries, minimize classpath conflicts, and optimize runtime performance. This alignment with the latest Java standards positions jPOS as a forward-looking solution for today’s demanding payment environments.
As part of this transition, we have deprecated OSGi support due to its low traction over the years. Despite a handful of deployments on platforms like Apache Karaf and IBM CICS/Liberty, feedback was minimal, and adoption remained low. The shift to Java Modules provides a more robust and future-proof solution for modularity, aligning jPOS with modern Java standards.
IsoTagStringFieldPackager and auto-configuration of enum fields.IFB_LLLLLLCHAR, IFB_LLLHEX, and IFEPE_LLBINARY.ZoneId support for better log management.compat_1_5_2 and QNode, aligning the codebase with modern usage patterns.ISODate and improved support for track data generation.This release represents a forward-looking approach, embracing modern Java standards, improving security, and delivering powerful new tools for developers. Whether you're building cutting-edge payment solutions or maintaining existing systems, jPOS 3.0.0 offers the foundation needed to innovate and scale with confidence.
The jPOS Gradle Plugin as of 0.0.12 has been updated to support jPOS 3.
References:
QBeans have a very simple lifecycle:
When Q2 starts, it reads all the QBeans available in the deploy directory and calls init on all of them, then start, using alphabetical order. That's the reason we have an order convention: 00* for the loggers, 10* for the channels, 20* for the MUXes, 30* for the TransactionManagers, etc.
This startup lifecycle has served us well for a very long time, but when we start getting creative with the Environment and the Environment Providers, things start to get awkward.
With the environment providers, we can dereference configuration properties from YAML files, Java properties, or operating system variables. These variables can have a prefix that indicates we need to call a provider loaded via a ServiceLoader. For example, an HSM environment provider allows you to use properties like this: hsm::xxxxxx, where xxxxxx is a cryptogram encrypted under the HSM's LMKs.
To decrypt xxxxxx, we need to call the HSM driver, typically configured using a QBean.
Imagine this deploy directory:
20_hsm_driver.xml
25_cryptoservice.xml
The cryptoservice wants to pick some configuration properties (such as its PGP private key passphrase) using the HSM, but it needs the HSM driver to be already started.
Up until now, Q2 would have called:
hsm_driver: init methodcryptoservice: init methodBut the cryptoservice, at init time, needs to block until the hsm_driver is fully operational, which requires its start callback to be called.
The solution is simple: we now have an eager-start attribute:
<qbean name="xxx" class="org.jpos.xxx.QBeanXXX" eager-start="true">
...
...
</qbean>
When Q2 sees a QBean with the eager-start attribute set to true, it starts it right away.
In jPTS’ user interface, we need a way to click on a given card and show all transactions for that card over a specified period of time. Because all sensitive data is stored using AES-256 in the secureData column of the tl_capture table using the CryptoService—a column that can be further encrypted at the database level—we need a lightweight, database index-friendly, one-way consistent hash of the primary account number.
Because computing a hash these days is an extremely fast operation, knowing the last four digits of a 16-digit PAN and the hash is enough information to brute-force the full PAN in a matter of milliseconds. Therefore, jPTS uses a dynamic per-BIN secret that incorporates several layers of defense.
Here is a screenshot of the UI page that requires this feature. When you click on a specific card, the transactions for that card alone are displayed.
The 128-bit SHA-1 algorithm, the same as other hash algorithms can be brute forced to produce a collision under certain circumstances. With today’s CPUs, finding a collision would take approximately 2600 years, a time that can be reduced to about 100 years using a cluster of GPUs. In 2017, the first collision for SHA-1 1 was found. Further research has provided additional cryptanalysis strategies that could theoretically reduce this time to approximately 24 days. (See also 2345).
Imagine you have a PDF file that has the SHA-1 hash:
845cfdca0ba5951580f994250cfda4fee34a1b58
Using the techniques mentioned above, it is theoretically feasible to find another file different from the original one that has the same hash, though this requires significant computing effort. However, this scenario applies to large files, not to small 16 to 19 digit Primary Account Numbers (PANs).
When dealing with a limited number of digits, especially where the last digit must satisfy a modulus 10 condition (LUHN)6, finding a collision is not possible as there are no collisions. Studies have shown that the minimum size for a collision is approximately 422 bytes7. This refers to full 8-bit bytes, not just a restricted pattern within the ASCII range of 0x30 to 0x39 (representing digits 0 through 9).
Going to an extreme, imagine you have just one digit, from 0 to 9:
| # | SHA-1 hash |
|---|---|
| 0 | b6589fc6ab0dc82cf12099d1c2d40ab994e8410c |
| 1 | 356a192b7913b04c54574d18c28d46e6395428ab |
| 2 | da4b9237bacccdf19c0760cab7aec4a8359010b0 |
| 3 | 77de68daecd823babbb58edb1c8e14d7106e83bb |
| 4 | 1b6453892473a467d07372d45eb05abc2031647a |
| 5 | ac3478d69a3c81fa62e60f5c3696165a4e5e6ac4 |
| 6 | c1dfd96eea8cc2b62785275bca38ac261256e278 |
| 7 | 902ba3cda1883801594b6e1b452790cc53948fda |
| 8 | fe5dbbcea5ce7e2988b8c69bcfdfde8904aabc1f |
| 9 | 0ade7c2cf97f75d009975f4d720d1fa6c19f4897 |
You can see there are no collisions. If we add two digits, there are no collisions either. With three digits, still none. Even with 16 digits, none. At 19 digits, none. And with 100 digits, still none. The shortest collision theoretically possible is around 422 bytes, but we're talking about full 8-bit bytes here, not just limited to the scope of 0x30 to 0x39 values, which also need to honor the LUHN algorithm.