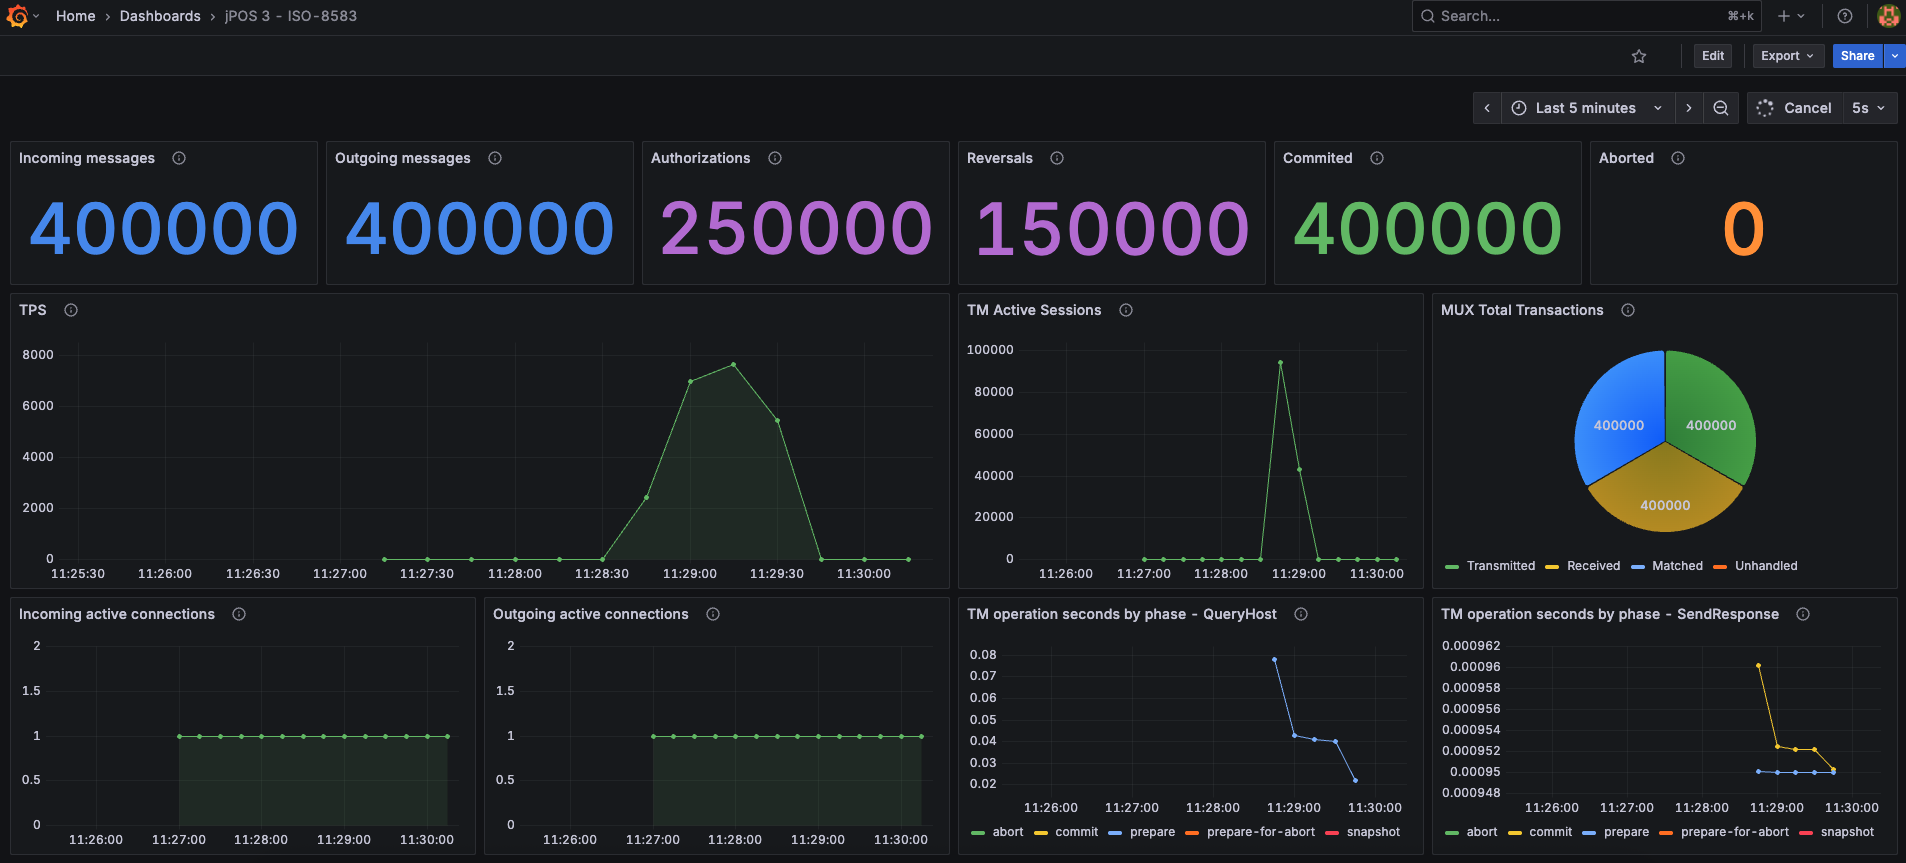
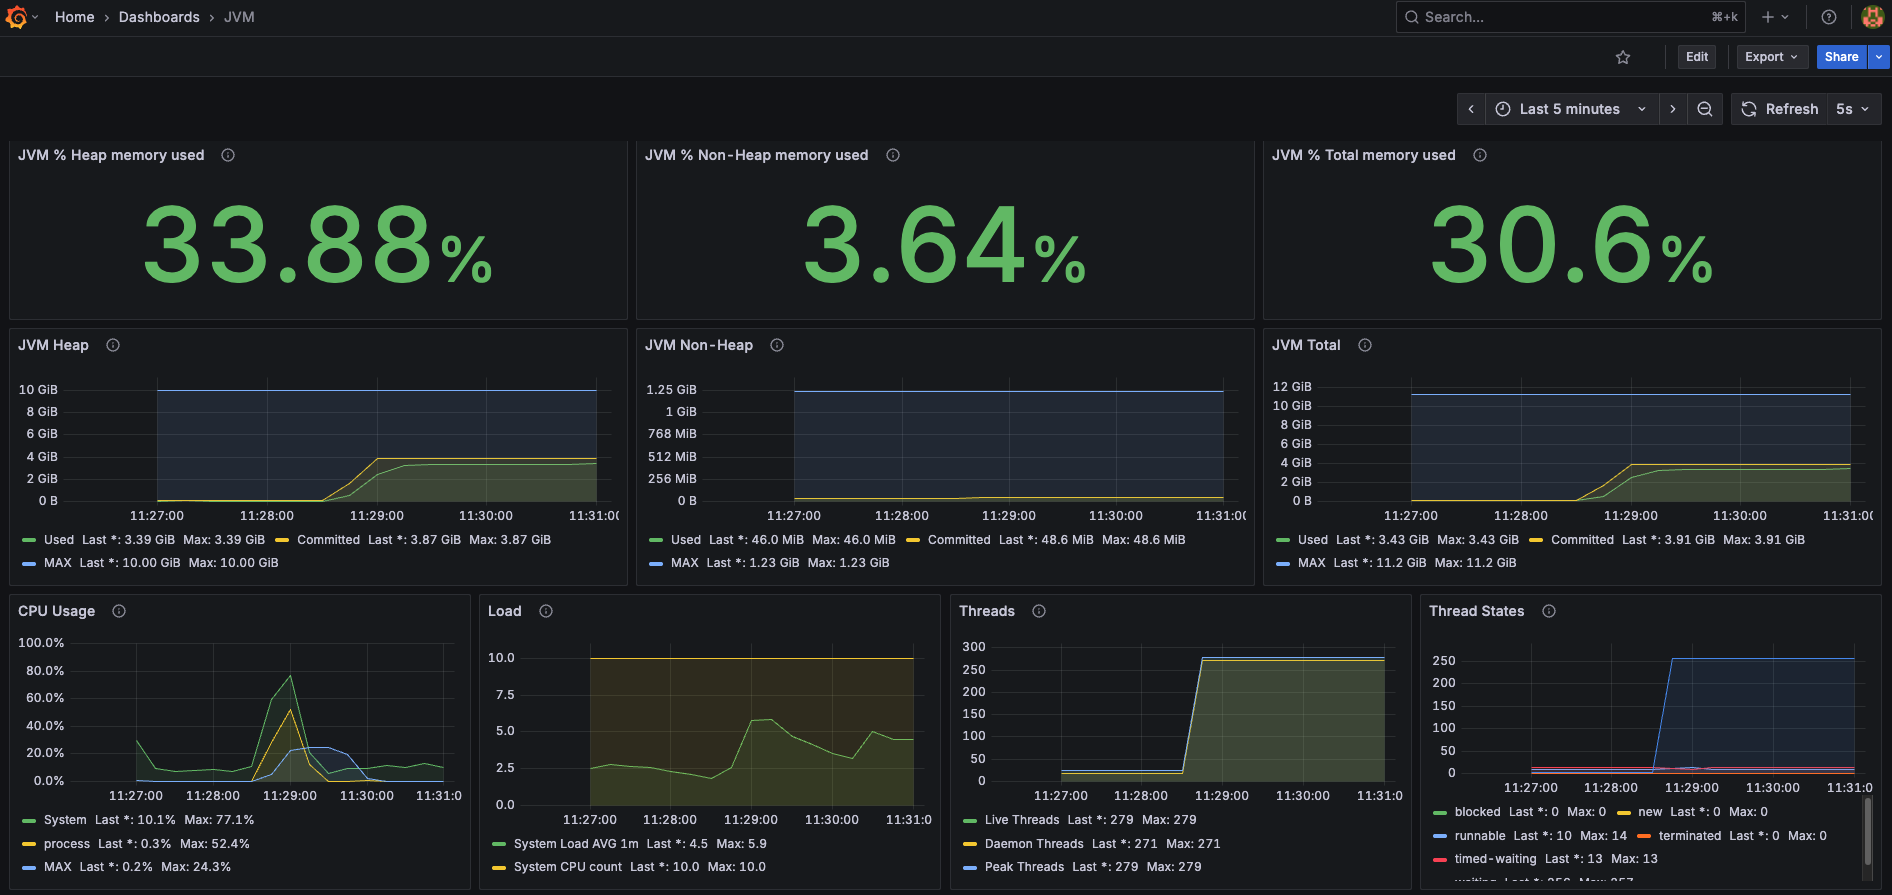
jPOS Metrics Explorer: logs and AI in the loop


Most jPOS-based applications are monitored using Elasticsearch, Kibana, and Grafana, or commercial alternatives such as Datadog, Splunk, and New Relic—and I never liked that.
External monitoring solutions usually rely on a Java agent that gives a remote server access to the JVM. These applications are often PCI certified because many QSAs don't fully understand what a JVM is or how powerful a javaagent can be. Otherwise, they would probably be considered uncertifiable or, at the very least, could extend the scope of your CDE to the remote provider. That's one of the reasons I wrote SensitiveStrings: to keep in-JVM sensitive data encrypted most of the time, adding a little defense-in-depth and flying under the radar of scripts looking for sensitive card data.
Elasticsearch is an awesome tool, but it's overkill to dump all your payload into it, such as verbose jPOS logs. We use it together with Debezium to store pointers to transaction data, not the transaction data itself, which would otherwise just replicate primary storage. Kibana is excellent for monitoring indexed business data, but log data is inherently unstructured. It evolves over time, and the queries evolve with it.
Grafana is also a great product, but dashboards are typically designed once, tweaked during development, and then left untouched for years. Eventually, a new DevOps team member inherits them without really knowing how they were built or how to modify them.
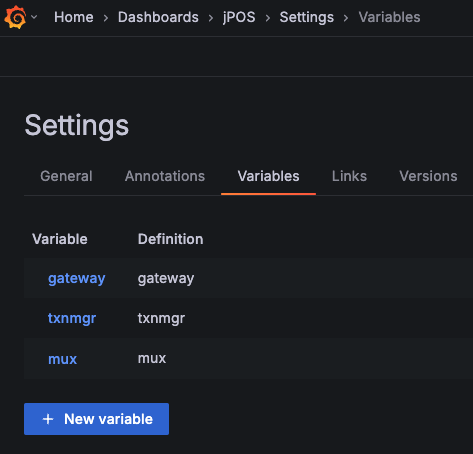
Those concerns led me to integrate metrics directly into jPOS using Micrometer, producing native Prometheus and OpenTelemetry metrics so we can eliminate remote Java agents altogether. I also worked on Structured Logging so logs are precise enough that you don't have to rely on regular expressions to search for information, and instrumented jPOS with Java Flight Recorder for the situations where we need to perform deep JVM forensics.
All those pieces are finally coming together in the integrated Metrics Explorer and Log Viewer. When you're investigating a problem, you can click on a graph and jump directly to the corresponding structured log messages with a single click. Instead of being limited to predefined dashboards, you have the full power of PromQL at your fingertips.
And then comes the final piece: integrated AI.
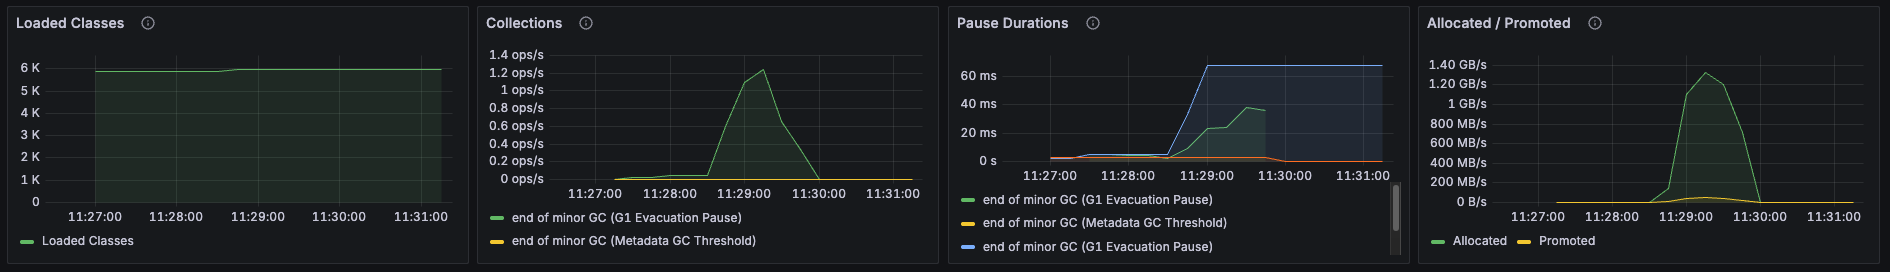
You can simply ask, "Please check if we have GC pressure over the last six hours," click the jPOS AI icon, and immediately have that free-text request translated into PromQL. No need to know the metric names, labels, or query syntax—the AI does that for you.
The goal isn't to replace Prometheus, Grafana, Elasticsearch, or Kibana. They remain fantastic tools. The goal is to make jPOS itself understand its own runtime well enough that the most common operational and forensic tasks can be performed from a single, integrated environment, without shipping logs and JVM internals to external systems by default.
Metrics are excellent at telling you that something changed. They are less good at explaining why.
That gap usually sends an operator across several tools: a dashboard for the symptom, a query editor to narrow it down, a log system for the events around it, and perhaps documentation to reconstruct the right query. The latest jPOS Control Plane demo brings those steps together without making the result opaque.
The Metrics Explorer works with the Prometheus metrics exposed by a running jPOS application. It lets an operator move from a chart to the relevant logs, ask questions in plain language, and inspect or run the generated PromQL before relying on it.