jPOS Monitoring

jPOS Monitoring
/by Orlando Pagano a.k.a. Orly/
As of jPOS 3, a Docker Compose setup is included out of the box to monitor jPOS using Prometheus and Grafana.
This setup provides a ready-to-use environment to visualize metrics exposed by the jPOS metrics module, with preconfigured dashboard and data source.
Repository
Project Structure
.
├── grafana
│   └── dashboards
│       ├── jPOS.json
│       └── JVM.json
│   └── provisioning
│       ├── dashboards
│       │   └── dashboards.yaml
│       └── datasources
│           └── datasource.yaml
├── prometheus
│   └── prometheus.yaml
└── compose.yaml
Docker Compose Setup
compose.yaml
services:
  prometheus:
    image: prom/prometheus
    ...
    ports:
      - 9090:9090

  grafana:
    image: grafana/grafana
    ...
    ports:
      - 3000:3000
This Compose file defines a stack with two services: prometheus and grafana.
When deploying the stack, Docker maps each service's default port to the host:
- Prometheus: http://localhost:9090
- Grafana: http://localhost:3000
Note: Ensure ports 9090 and 3000 on the host are available.
You don’t need any additional infrastructure — both services run entirely via Docker containers.
Prometheus Behavior and Storage
- Prometheus polls servers (any number of them) every 15 seconds by default — this is configurable but a good starting point.
- It’s highly efficient, storing each metric at about 1.3 bytes per sample (~11 bits).
- Grafana queries Prometheus as its data source for visualization.
- By default, Prometheus stores data under
/prometheusinside the container. To retain metrics across restarts, mount a persistent volume — otherwise, data will be lost when the container is rebuilt or removed.
Deploying the Stack
To start the monitoring stack:
$ cd <jPOS-monitoring-root>/dockerfiles/jPOS-monitoring
$ docker compose up -d
[+] Running 4/4
 ✔ Network jpos-monitoring_dashboard-network  Created                                                                                                                                                                              0.0s
 ✔ Volume "jpos-monitoring_prom_data"         Created                                                                                                                                                                              0.0s
 ✔ Container prometheus                       Started                                                                                                                                                                              0.4s
 ✔ Container grafana                          Started
Additionally, the just tool is included as an optional helper to simplify command execution.
Requirement: just (Installation guide)
To start the monitoring stack using just tool:
$ just monitoring-up
Expected Result
Confirm that both containers are running and ports are correctly mapped:
$ docker ps
CONTAINER ID   IMAGE             COMMAND                  STATUS       PORTS                    NAMES
dbdec637814f   prom/prometheus   "/bin/prometheus --c…"   Up 8 mins    0.0.0.0:9090->9090/tcp   prometheus
79f667cb7dc2   grafana/grafana   "/run.sh"                Up 8 mins    0.0.0.0:3000->3000/tcp   grafana
-
Open http://localhost:3000 to access Grafana.
- Login with
admin / grafana. Prometheus is preconfigured as the default data source.
- Login with
-
Open http://localhost:9090 to access Prometheus
Stopping the Stack
To stop and remove the containers:
$ docker compose down # Use -v to remove volumes
To stop using just tool:
$ just monitoring-down
To stop and remove the containers using just tool:
$ just monitoring-down-remove
jPOS Metrics Integration
At the jPOS level, you only need to expose the metrics endpoint using the -mp option:
$ q2 -mp 18583
You can use any port, but 18583 is the conventional default in jPOS for metrics.
To verify it's working:
$ curl http://localhost:18583/metrics
This confirms the embedded jPOS metrics server is accessible.
Alternative: Configure in cfg/default.yml
Port 18583 is the default port used by the jPOS metrics server, but that’s just an arbitrary value and can be configured in cfg/default.yml or as a parameter to the bin/q2 script.
If you configure using cfg/default.yml, you need to add something like this:
q2:
  args:
    --metrics-port=18583
This keeps the port definition centralized and consistent across environments.
Sample Dashboards
Here’s what you’ll see once everything is running:
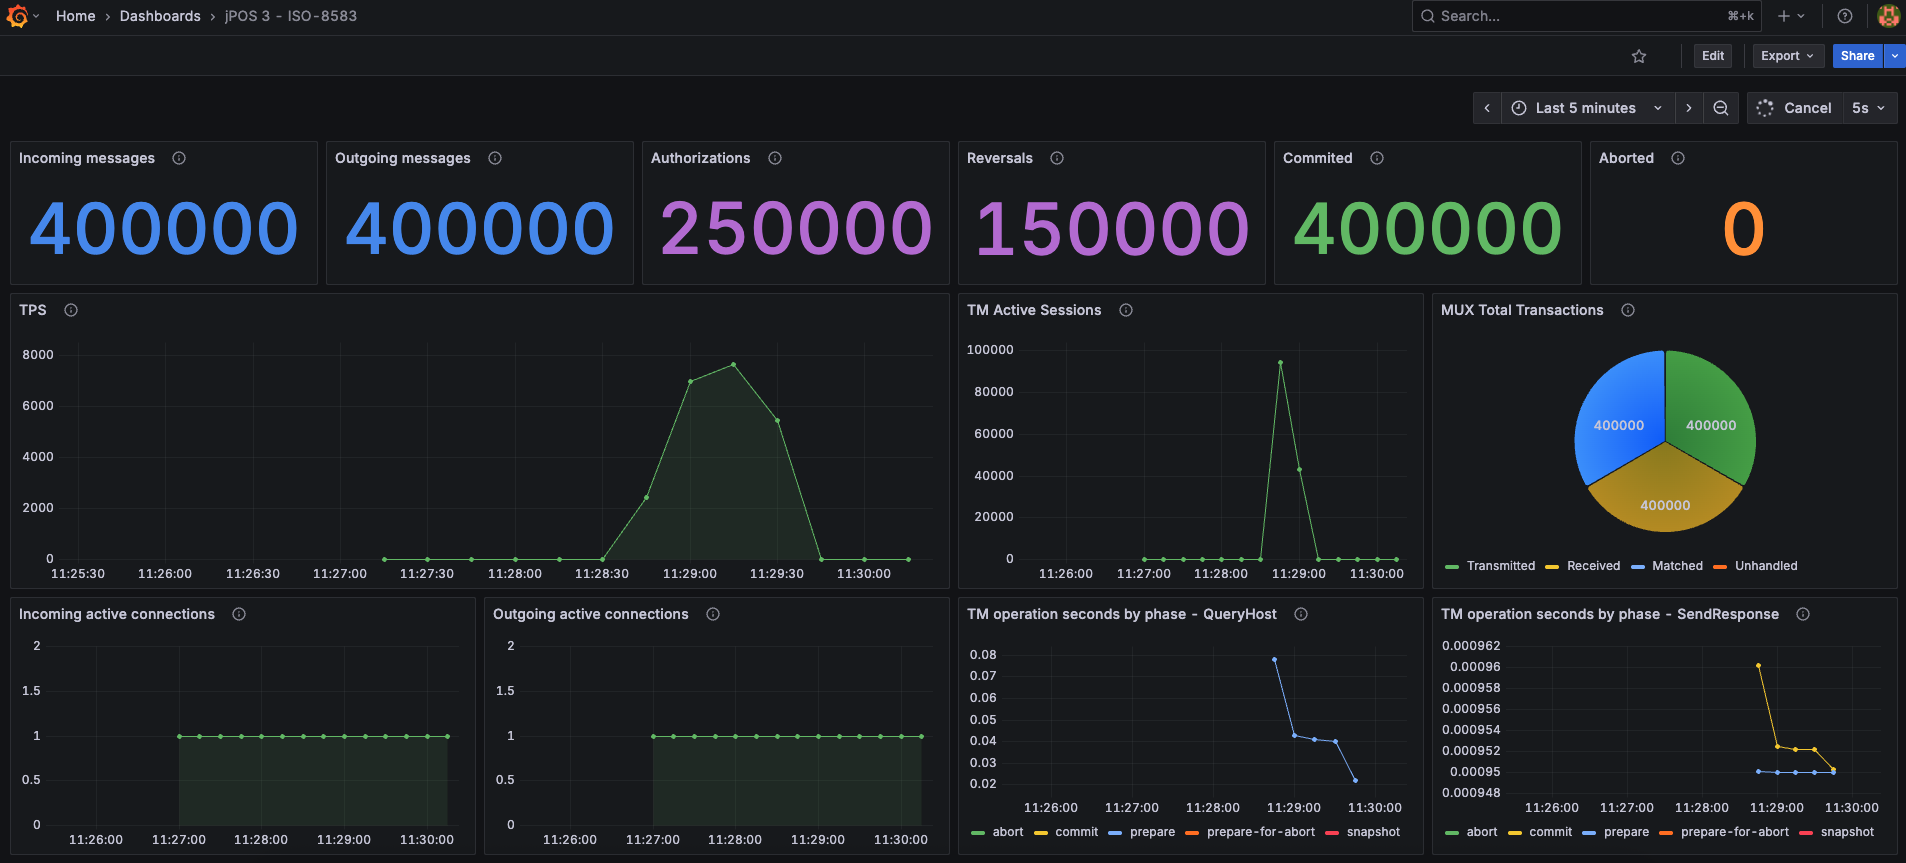
jPOS Dashboard
This dashboard provides insights into jPOS-specific metrics such as ISO messages processed, TPS, MUX activity, active sessions, and active connections.
By default, the dashboard assumes that the TransactionManager runs the QueryHost and SendResponse participants, and their metrics are displayed.
Metrics from other participants can also be added, or existing ones edited or removed as needed.
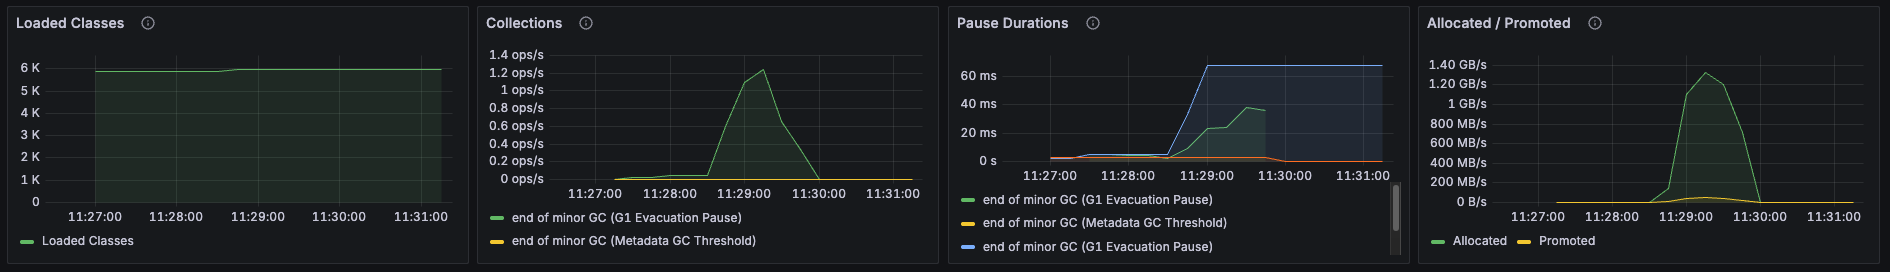
JVM Dashboard
This dashboard tracks JVM-level stats like memory usage, garbage collection, thread counts, and class loading.
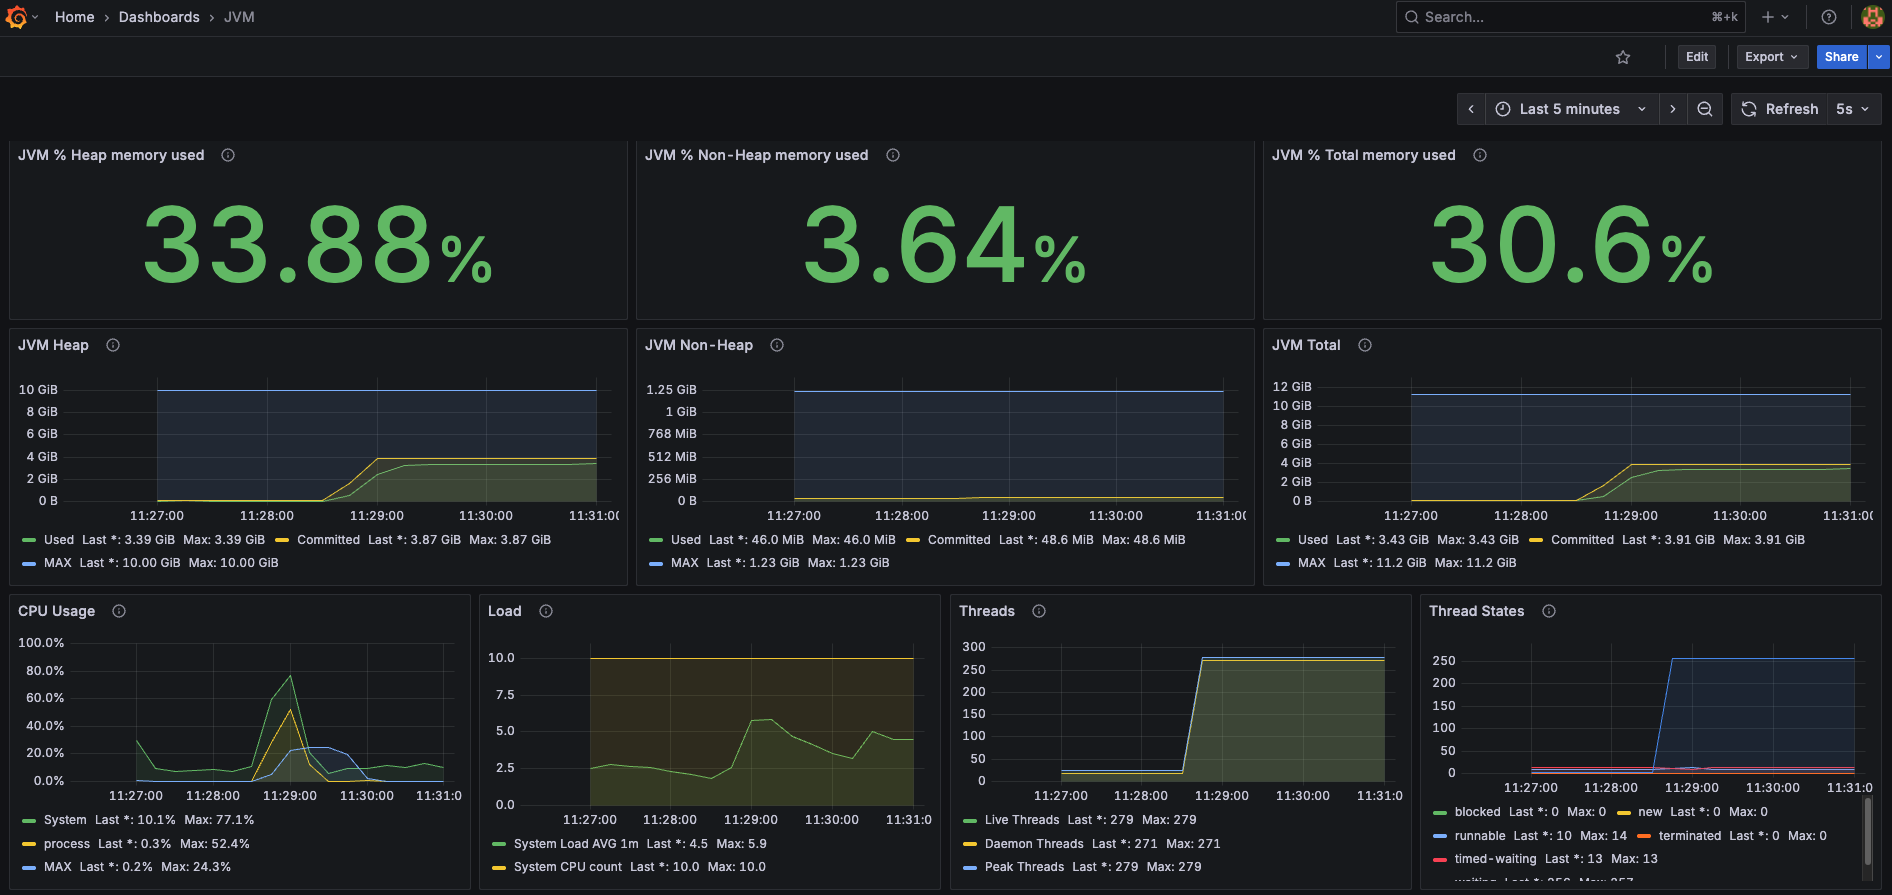
These dashboards are available in the repository under
grafana/dashboards/.
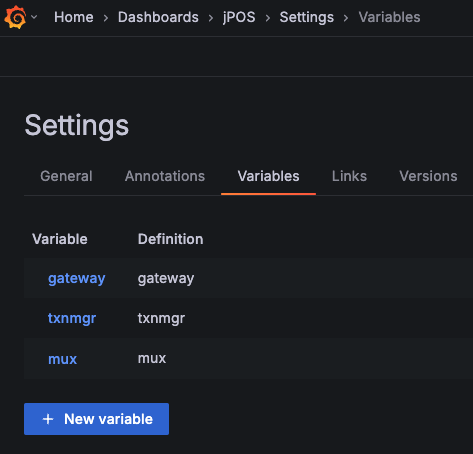
jPOS Dashboard Variables
By default, the Grafana dashboard includes three predefined variables that can be customized as needed:
-
gateway– Used within the dashboard asname="$gateway"This corresponds to the name assigned to the QServer instance that receives incoming messages in jPOS.
Example:
<server class="org.jpos.q2.iso.QServer" name="gateway"> -
txnmgr– Used within the dashboard asname="$txnmgr"This corresponds to the name of the TransactionManager responsible for orchestrating the participants in jPOS.
Example:
<txnmgr class="org.jpos.transaction.TransactionManager" name="txnmgr"> -
mux– Used within the dashboard asname="$mux"This corresponds to the name assigned to the QMUX used by jPOS to communicate with an external network.
Example:
<mux class="org.jpos.q2.iso.QMUX" name="mux">
A screenshot of the dashboard variable editor is included below to illustrate where these values can be modified.
All dashboards, variables, and other Grafana configurations can be modified as needed to fit your specific setup or preferences.